If you use more than one marketing platform, you have probably noticed that your “Share of Voice” figure is rarely the same in two different places. In most cases, that difference is expected: Share of Voice means different things on different platforms, and not every tool that shows you a percentage is measuring the same underlying quantity.
This article explains exactly how First Look Games calculates Share of Voice, and why the figures inside FLG may differ from figures produced by SEO tools, media monitoring services or other industry platforms.
Key takeaways
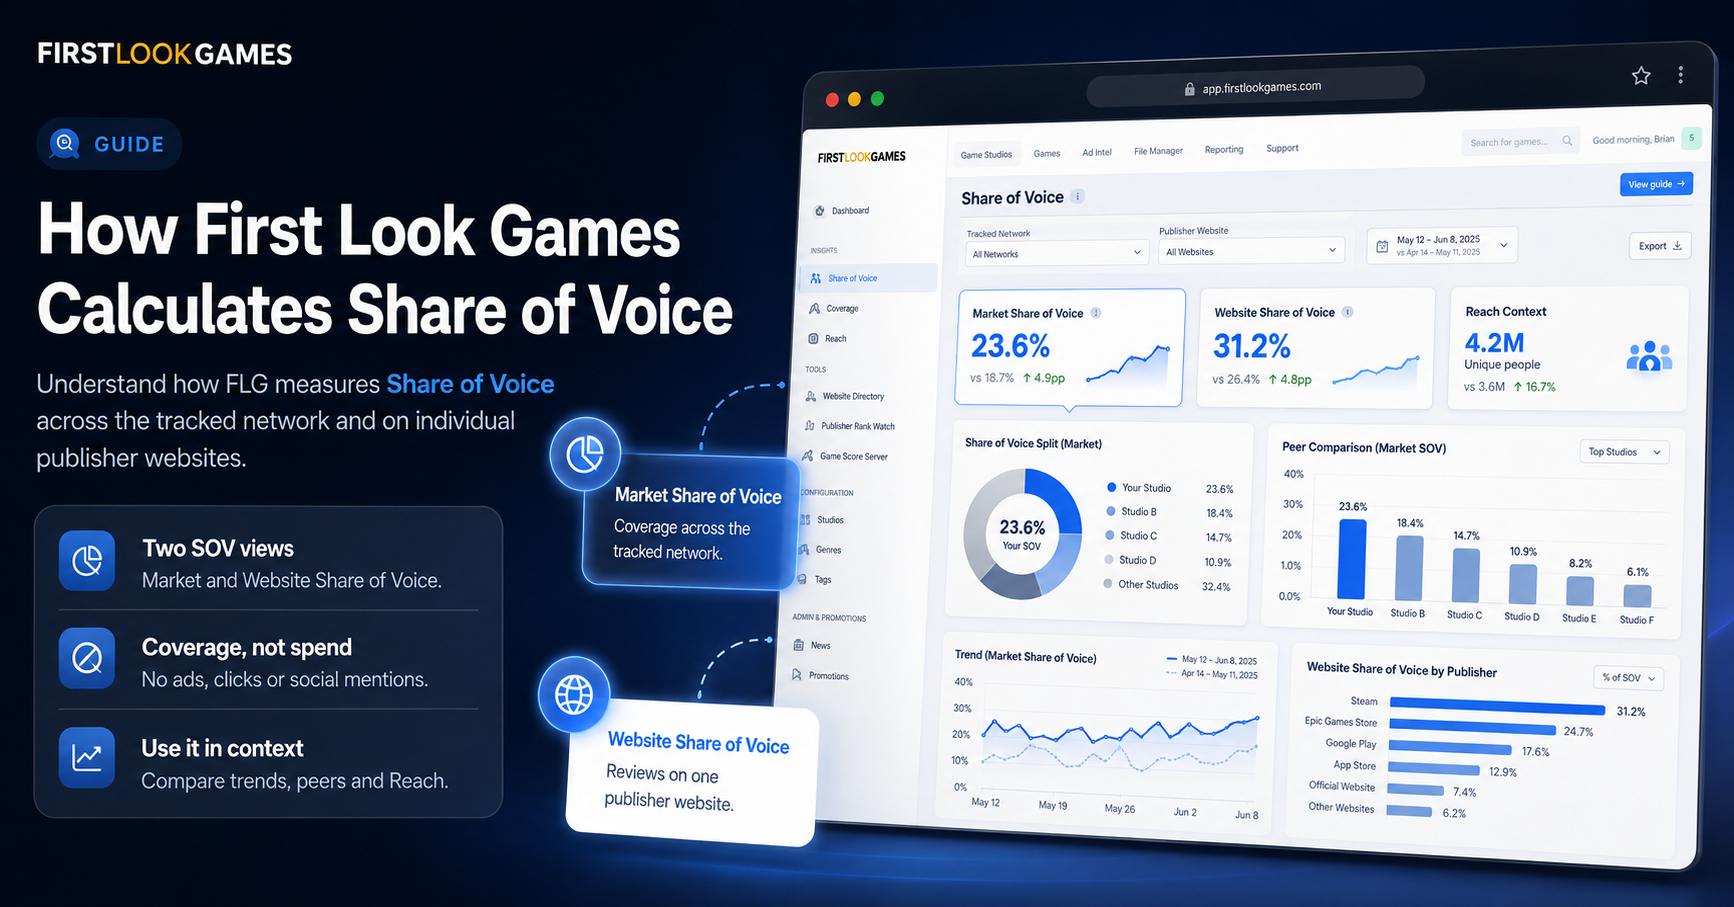
- First Look Games measures two kinds of Share of Voice: Market Share of Voice across the tracked network, and Website Share of Voice on a single publisher website.
- Market Share of Voice measures detected game coverage across the tracked network, while Website Share of Voice measures reviews on one publisher website. Neither measures ad spend, search clicks or social mentions.
- There is no universal “good” percentage. Share of Voice becomes useful through trend, peer comparison and context from the Reach metric.
What First Look Games means by Share of Voice
First Look Games measures two distinct Share of Voice metrics, both expressed as simple percentages.
Market Share of Voice, shown in Studio Benchmark, is your studio’s detected game coverage as a percentage of all detected game coverage across FLG’s tracked publisher and B2B industry network. Every studio is measured against the same network total for the selected period.
Website Share of Voice, shown in a Website Report selected from the Website Directory, is your studio’s reviews as a percentage of all reviews on that individual publisher website.
Both metrics count real, captured coverage pages that FLG’s system has detected and matched to specific games. They are measures of actual published coverage – not modelled search clicks, not advertising spend and not social media mentions.
Market Share of Voice and Website Share of Voice are deliberately different metrics. Market Share of Voice counts all detected game coverage types across the entire tracked network, over a chosen completed-month window. Website Share of Voice counts reviews only on a single publisher website, with no date window. They answer different questions: strategic market overview versus operational per-site detail. A studio’s two percentages will rarely match, and they are not designed to.
The numerator and denominator
Market Share of Voice
The numerator is your studio’s detected game coverage pages across all tracked publisher and B2B industry websites. The denominator is all studios’ detected game coverage pages across the same network. The denominator is not user-configurable – every studio looking at the same period sees the same network total.
Website Share of Voice
The numerator is your studio’s reviews on the publisher website. The denominator is all studios’ reviews on that same website. The denominator is specific to that site, and by definition a different site produces a different result. Website Share of Voice always refers to the logged-in studio’s share on a Website Report accessed through the Website Directory.
What coverage and periods are included
Market Share of Voice
Market Share of Voice counts all detected game coverage types across the tracked network. Re-detections of the same page are excluded from Market Share of Voice.
The coverage window can be set to 6, 12 or 24 completed calendar months, or all-time. The default is 12 months. The current partial month is always excluded, so every window contains only completed months and comparisons are not distorted by partial data.
Website Share of Voice
Website Share of Voice counts reviews only. Separate reviews that appear similar may still count where they represent valid coverage – for example, versions published by the same site in different languages. The coverage is all-time cumulative with no date window.
The tracked network
The tracked network includes publisher websites and relevant B2B industry sites. Studio-owned websites and operator websites are excluded.
Potential Share of Voice
The Website Report also includes a modelled measure called Potential Share of Voice. It estimates the share a studio could reach if the publisher website reviewed its full game catalogue at the same average review density it currently gives the studio’s covered games. It calculates the publisher’s existing reviews per covered game, applies that review density to the studio’s full catalogue, then recalculates the studio’s possible share of reviews on the site.
Potential Share of Voice is a modelled headroom estimate, not measured coverage. It is not a forecast, target or prediction that the publisher will review those games. It requires the studio to have at least some existing coverage on the site from which to calculate a review density.
Why FLG’s Share of Voice differs from other platforms
“Share of Voice” has become a widely used term across marketing, but it describes at least three unrelated quantities depending on which tool you are using.
SEO platforms such as Semrush and Ahrefs calculate Share of Voice as the estimated share of organic search clicks from a set of keywords the user has chosen to track. The figure combines search-volume estimates, observed rankings and modelled click-through assumptions.
Media monitoring platforms such as Meltwater and Brandwatch calculate Share of Voice as the share of mentions or impressions from a set of competitor queries the user has configured. Changing those queries changes the result.
Classic advertising Share of Voice measures a brand’s share of total category advertising spend.
FLG’s Market Share of Voice measures detected game coverage across a common tracked network within the iGaming industry. Every studio is measured against the same network total for the selected period. The denominator is the same for every studio, and each unit counted is a real, captured coverage page matched to a specific game. The figures from these different platforms are not directly comparable and should not be expected to match.
A worked example
For example, suppose a studio has 420 detected game coverage pages across the tracked network over the last 12 months, and the network records 10,000 detected game coverage pages during the same period.
Market Share of Voice = 4.20%
On one publisher website, the same studio has 12 reviews out of a site total of 340 reviews.
Website Share of Voice on that site = 3.53%
The two percentages measure different things – one is the studio’s share of all coverage detected across the network; the other is its share of reviews on a single site – and they do not need to agree.
How to judge your Share of Voice
There is no universal “good” Market Share of Voice percentage. It is a relative metric, so it only becomes useful in context. Overall coverage can rise or fall while your percentage remains unchanged.
Assess it through:
- Trend: Is your share rising, stable or falling across equivalent periods?
- Peer position: How do you rank against studios in the same tier, selected competitors or all studios?
Every studio uses the same network denominator within a selected period. The peer filter changes the ranking shown, not your Share of Voice percentage. Your own previous results also provide a useful benchmark.
On a Website Report, Website Share of Voice shows your current share of reviews on that site. Potential Share of Voice estimates how that share could change if the site reviewed your full catalogue at its existing review density. Together, they indicate where there may be room for more coverage, although Potential Share of Voice is a modelled estimate rather than a forecast.
Market Share of Voice should also be viewed alongside Reach because every coverage page has equal weight, regardless of the publisher’s audience size.
What studios can reasonably use it for
Marketing teams can use Market Share of Voice during monthly or quarterly coverage reviews to track whether their share of detected game coverage is growing or declining. Senior teams can use it when comparing current performance with previous equivalent periods.
Affiliate and account managers can use Website Share of Voice and Potential Share of Voice when assessing an individual publisher through the Website Directory – before reviewing a relationship or deciding where to focus outreach.
What it does not measure
Neither Market Share of Voice nor Website Share of Voice measures revenue share, market share, player numbers or exposure, operator distribution, advertising visibility, social media discussion or coverage on websites that FLG does not track.
Neither metric measures publisher importance or prominence. Every detected game coverage page has equal weight regardless of the publisher’s audience size or industry standing. Share of Voice is share of detected game coverage within FLG’s tracked publisher and B2B industry network – nothing more and nothing less.
Frequently asked questions
Why does my Share of Voice figure in FLG look different from the figure I see in my SEO platform?
Because they measure completely different things. Your SEO platform estimates your share of search clicks from keywords you chose to track. FLG counts detected coverage pages matched to your games across its common tracked network.
Why is my Website Share of Voice different from my Market Share of Voice?
Market Share of Voice counts all detected game coverage types across the entire tracked network over a chosen completed-month window. Website Share of Voice counts reviews only on one publisher website with no date window. They are deliberately different metrics answering different questions.
Is a higher Share of Voice always better?
Not necessarily. A higher percentage can mean your coverage has grown, but it can also result from other studios receiving less coverage during the same period. Trend and peer position provide more context than the absolute number alone.
How often does my Share of Voice figure update?
Both Market Share of Voice and Website Share of Voice refresh weekly.
Log in to Studio Benchmark to review your Market Share of Voice, or select a publisher from the Website Directory to see your Website and Potential Share of Voice.