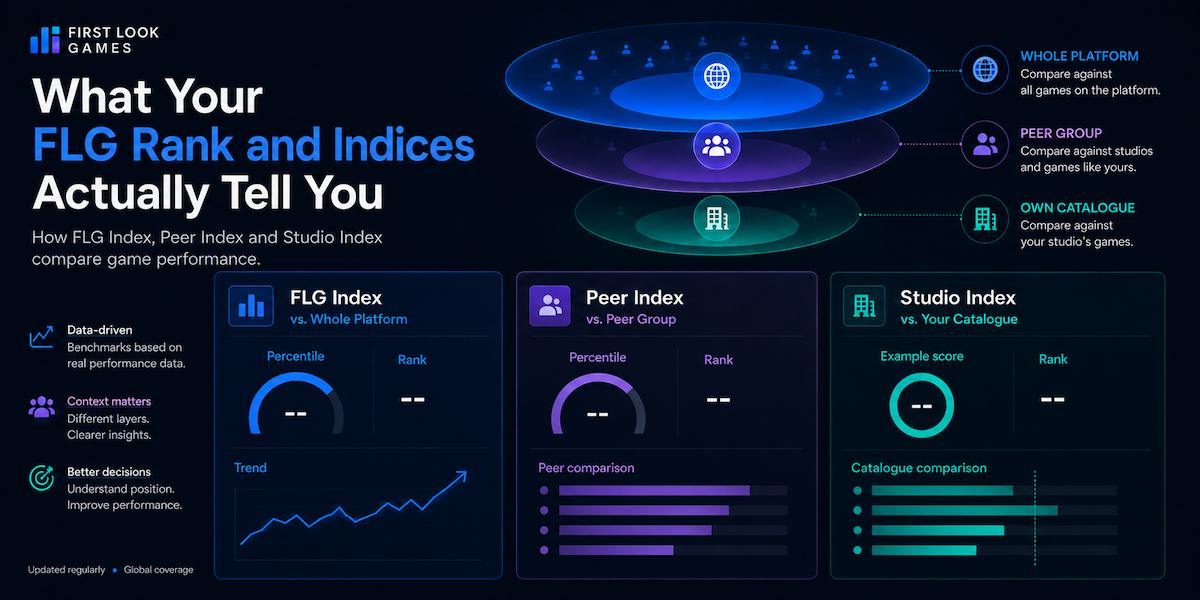
A studio logs into First Look Games and sees six different numbers describing where a game stands: FLG Index, Peer Index, Studio Index, FLG Rank, Peer Rank, Studio Rank. One game might show FLG Index 72, Peer Index 58 and Studio Index 200.
Another shows lower figures across the board. The studio asks a fair question: why is our game ranked where it is, and what is the difference between these numbers?
Key takeaways
- FLG Index measures your game against the whole platform. Peer Index measures it against comparable studios. Studio Index measures it against your own catalogue.
- For FLG Index and Peer Index, 100 means top of the field and an average game scores about 50. For Studio Index, 100 means exactly your median game – and it can go higher.
- Scores from different dates are not directly comparable. The useful signal is relative movement over time, not the absolute index number as a fixed historical benchmark.
The six figures, and what 100 means in each
| Figure | What 100 means |
| FLG Index | Top of the whole platform. An average game scores about 50. |
| FLG Rank | 1 = the highest-ranked game. Shown as “N / total games.” |
| Peer Index | Top of your tier. An average game within its tier scores about 50. |
| Peer Rank | 1 = the highest-ranked game in the tier. |
| Studio Index | Exactly your studio’s median game. Can exceed 100 – a studio’s top game in a 10-game catalogue scores 500. |
| Studio Rank | 1 = your studio’s highest-ranked game. |
The most important distinction: for FLG Index and Peer Index, 100 is the top of the field. For Studio Index, 100 is the middle of your own catalogue. If you read Studio Index through the lens of the other two, you will misinterpret it every time.
How the numbers are built
The two inputs: hits and reach
FLG Index starts with two raw measurements per game.
Hits are verified coverage pages – reviews, news stories, game listings or landing pages found on tracked publisher sites, classified through automated detection with human moderation oversight. One qualifying page equals one hit.
Estimated reach sums the audience size of each distinct website covering your game. Ten articles on one publisher site count that site’s audience once, not ten times. Reach is a modelled estimate of potential exposure – directional, not a count of readers.
The platform continuously discovers and captures new coverage through automated scanning. Each new verified page adds to the hit count and, if the publisher website is newly covering the game, to the reach figure.
From raw numbers to percentiles
Raw hit counts and reach figures cannot be compared directly. A flagship game from a large studio might attract hundreds of hits, while a smaller studio’s title collects a few dozen. Placing them side by side requires a common scale.
FLG solves this with percentiles. Every game’s hit count is ranked against every other game’s hit count, producing a 0–100 percentile score. The same process is applied to reach. A game at the 80th percentile for hits has more coverage pages than 80% of all games on the platform, regardless of how large the raw number is.
FLG Index is the average of those two percentiles: (hits percentile + reach percentile) ÷ 2. Hits and reach carry equal weight. FLG Rank is the 1-is-best ordering of all games by their FLG Index.
Peer Index and Peer Rank use the identical formula, but the percentiles are computed only within the game’s studio tier. A game might score FLG Index 80 globally but Peer Index 62 within its tier, meaning it performs strongly against the full platform but faces stronger competition among its closest peers.
Studio Index is different mathematics altogether. It compares a game only against the studio’s own catalogue. The formula is (median catalogue position ÷ this game’s position in the catalogue) × 100. The median game always scores 100. A game that ranks higher than the median scores above 100; a game below the median scores below 100.
What does not feed the index
Downloads and demo game sessions do not contribute to any FLG index or rank. The index measures market response – coverage, exposure and the way publisher content describes your game – not engagement with your asset kit.
Peer groups and why scores shift
Your peer group is determined by your studio’s FLG Tier. Tiers run from 1 to 10 and work similarly to leagues in sport.
Every active studio receives a composite score based on total coverage performance, per-game efficiency, plus small adjustments for portfolio size and catalogue consistency. The top 10% of studios form Tier 1, the next 10% form Tier 2, and so on down to Tier 10. Your peer group is “all games from studios at a similar overall performance level,” not studios of similar size.
Because tiers are pure deciles of a relative ranking, they move as the market moves. A studio that stays still while others grow may drop a tier without any decline in its own numbers. Peer Index and Peer Rank can change because the peer group changed, not because your game changed.
This is also why comparing index scores across different dates is misleading. There are three mechanisms at work, and all three are by design. Percentiles are population-relative: your index moves when other games gain or lose coverage, even if your data is unchanged. Tiers are recalculated each run, so the comparison group shifts. And the comparison base itself grows as the platform indexes more publisher pages – rank 400 out of 30,000 games last year and rank 400 out of 45,000 today are different achievements.
The useful comparison is relative movement over time rather than treating the absolute index score as a fixed historical benchmark. Directional change – rising or falling relative to peers – is what the index is designed to surface.
Recalculation is triggered at the end of each scanning cycle, typically weekly. A game’s underlying metrics refresh when its studio is scanned; its index and rank are recomputed platform-wide on every run. The platform stores a history snapshot from each run.
How to read your scores
Open your Studio Report and pick one game. Look at its FLG Index and FLG Rank first – that is your position in the full market. Then check its Peer Index and Peer Rank to see how it performs within your tier. A large gap between the two means your tier’s field is stronger or weaker than the global field – a prompt to drill into your coverage detail and understand why.
Then check Studio Index. If it sits above 100, the game is one of your stronger performers relative to your own catalogue. If it sits below, it is falling behind your median title.
Use FLG Index for external benchmarking, Peer Index for peer comparison within your performance bracket, and Studio Index to understand distribution within your own portfolio.
These figures appear on the Game Coverage cards in the Studio Report, as KPI cards on the Game Report, and across Compare Games, Game Benchmark and the Premium and Branded Game Reports. A note on new games: if a game has no qualifying coverage yet, its index card will show “data collection in progress” rather than a score of zero. This is normal. Scores appear once the platform has detected and verified coverage for that game.
A note on the monthly PDF
FLG analyses the content of each captured page. Pages containing an actual review receive a sentiment score from 1 to 8, from “Needs Improvement” through to “Gamechanger.” Pages without a review do not receive a rating.
Sentiment does not feed the standard FLG Index or Peer Index you see on the dashboard. It feeds a separate set of sentiment-adjusted figures, weighted toward the underlying index with sentiment as a meaningful secondary component.
Those sentiment-adjusted figures are what the monthly studio PDF uses – and the PDF takes the rank of the studio’s best game, not any individual game. This is why the headline number on your PDF may differ from what you see on the dashboard.
What the indices do not do
FLG Index and its related figures are directional, modelled indicators of market presence. They do not measure game quality, player satisfaction, operator performance, or commercial success. A game with a high index has strong coverage and broad publisher reach.
The indices are a decision-support tool. They help studios see where their games stand relative to the market and to each other. They are not a guarantee of coverage outcomes, publisher behaviour, or commercial performance.
FAQ
Why did my Peer Index change when my game’s coverage didn’t?
Your tier may have been recalculated because other studios moved, changing the peer group your game is compared against. Or other games within your tier gained or lost coverage, shifting the percentile distribution. A stable Peer Index alongside a changing FLG Index usually means your tier peers moved in step with your game, while games outside the tier drove the global shift.
Can I see how my scores have changed over time?
The platform stores a history snapshot from every recalculation, but no studio-facing history view exists yet. The closest studio-visible signal is the monthly PDF, which shows this month’s figures alongside all-time comparisons.
For more on how FLG collects and verifies the coverage underlying these indices, see the article on How First Look Games Calculates Share of Voice. For the methodology behind estimated reach, see Understanding Partner Reach: The First Look Games Traffic Methodology.